You need eCommerce metrics to assess your website’s performance to make improvements if needed. In this article, we’ll discuss the most common and important metrics both beginners and long-term merchants should always take into account.
What are eCommerce metrics?
Any quantifiable, regularly established calculation of website output is referred to as a metric. Some of the examples are conversion rate, average order value, cart abandonment rate, and traffic sources are all examples of good eCommerce metrics.
There’s a reason why the list of eCommerce metrics is so long. Google Analytics, social media, your online store, product pages, homepages, checkout, and shopping carts are all rich data sources that contain quantifiable data, ready for you to track and analyze over time.
When is the best time to check my eCommerce metrics?
You may be wondering how often you should review your metrics as we step through the most essential list. Well, the answer is always the same: “It depends.”
1. Once a week
Some metrics should be reviewed every week to ensure that the company is in good shape. Website traffic, social media interaction, and impressions are all examples.
2. Every two weeks
Bi-weekly metrics are better optimized for broader sample size, less affected by any differences that may arise within a given week when zoomed out from the weekly metrics. Average order value (AOV), cost per acquisition (CPA), and shopping cart abandonment is examples of bi-weekly metrics.
3. Monthly
Because of traffic trends or, more likely, your marketing patterns, monthly metrics necessitate a longer data window. Email open-paced, multichannel interaction, scope, and add-to-cart abandonment are examples of monthly metrics (or other micro-conversions).
4. Every three months
At least as described by these time intervals, quarterly metrics are the most strategic. These quarterly metrics will be the long-tail activities that prove that your company is thriving and rising, while your weekly and bi-weekly metrics have shown that your business is stable and surviving. Email click-through, consumer lifetime value, and subscription rate are examples of these metrics.
Crucial eCommerce metrics
1. Conversion rate
The percentage of visitors to your website who become customers is referred to as your conversion rate. An industry-standard conversion rate is about 2%, which might sound poor when considering the number of people surfing the internet every day. This is why the eCommerce competition is extremely fierce. Your conversion rate is acceptable if your online store makes one sale for every 50 visitors. However, due to the effectiveness of their eCommerce website, some online retailers may have a much lower conversion rate, while others have lifted theirs above 2%.
2. Abandonment of cart
Abandoned shopping carts, or cart abandonment, occur when customers add goods to their shopping cart and then exit the store without purchasing. When this happens more often than expected, it’s crucial to figure out why the customer would leave if they were curious enough to fill their cart. There are various causes for cart abandonment, with an estimate of 75% of all online shopping carts being abandoned.
3. Average order value
The average order value in your online store is just what it sounds like: the average monetary value of customer orders. This can be found in the dashboard of your eCommerce platform. This is a crucial statistic because it tells you how much money you make per client. Since it depends on what you’re selling, there’s no “standard” average order value to equate to yours. Instead, compare the cost of attracting new customers to the average order value. This will assist you in determining how much money you have available to spend on consumer acquisition.
4. Rate of Bounce
The number of website users who leave without viewing a second page is known as your bounce rate. This is traffic made up of people who come to your storefront for a few seconds and then leave without engaging. The average bounce rate is 36% or 36 visitors per 100.
Auto-generate data with Atom8
Normally, you have to use Google Analytics and your platform dashboard to gather data. However, these are often raw data that you need to calculate and visualize to attain the final performance pattern of your store. If you don’t have a centralized data gathering system, i’s easy to forget some data points that might mislead your analysis.
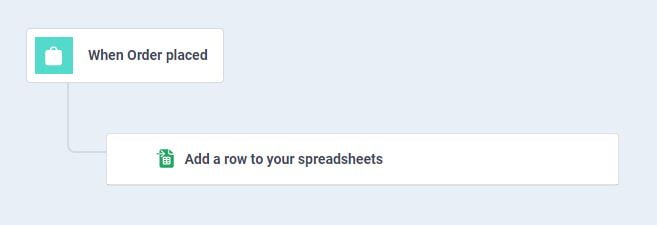
With Atom8, this is perfectly preventable. Every order placed in your store will be automatically generated into a spreadsheet that is connected to your CMR. This way, you no longer have to manually update information at the end of the day. Not only does it eliminate human error, but it also helps foster productivity.
 Check out Atom8 for BigCommerce stores today and enjoy your work!